- Introduction
- System Configuration and Environment Setup
- Using the Monitor Features
- Other Monitor Features
- Summary
- Other Startup Articles
- Contact Us
| Publish Date | 2017/12/26 |
|---|
Introduction
About this Series
This series provides information about the set-up procedures and the basic how-to of Hinemos. This series is intended for new users who are not familiar with its capabilities.
By following the tutorial of this series, it will provide you with the first steps for mastering Hinemos.
For the basic description of Hinemos, please see here
The previous tutorial Introduction (1) Getting Started with Hinemos explained the set-up procedures and the basic how-to of Hinemos. This tutorial will look into the monitor feature of Hinemos and will explain how to configure the monitor setting and to check the monitor results.
Prerequisite
This tutorial assumes that you have an environment created from the previous tutorial “Introduction (1) Getting Started with Hinemos”.
Notices
The version number of Hinemos (6.0.*) which appear in this tutorial shall be replaced as necessary with the version you are using.
Disclaimer
We will not be responsible for any loss or damage that may result from the use of this tutorial or any software introduced in this tutorial.
Environment Setup
We will be using the Hinemos Manager and the managed nodes created in introduction (1).Please refer to the “System Overview” section of the previous tutorial regarding the IP addresses and the system configuration, and the “2. Registering the managed nodes” and “3. Creating a scope” section for the node and scope.
Monitoring with Hinemos
Introduction (1) showed how to use the Ping Monitor. This time, we will talk about two other monitor features: Resource Monitor feature, which is required for monitoring the system’s resource, and the System Log Monitor feature, which is required for detecting faults in the system.
I. Resource Monitor
The Resource Monitor performs threshold judgement for the collected values acquired from the managed node, and notify the monitor result to the user. It can monitor the following resources.
- ◆CPU(Usage[%], Load Averages [units/s], etc.)
- ◆Memory(Usage[%], Swap[kB/s], etc.)
- ◆Disk(I/O Counts[counts/s], I/O Bytes[byte/s], etc.)
- ◆File System(Usage[%])
- ◆Network(Packet Count[counts/s], Network Amount[byte/s], etc.)
First, let’s configure the setting for the CPU, file system, and the network.
Procedures
        [root] # echo “view systemview included .1.3.6.1” >> /etc/snmp/snmpd.conf
        [root] # cat /etc/snmp/snmpd.conf
        …
        # Further Information
        #
        #  See the snmpd.conf manual page, and the output of "snmpd -H".
        view    systemview    included   .1.3.6.1
Restart the SNMP agent executing the following command as the root user to reflect changes.
        [root]# service snmpd restart
        Redirecting to /bin/systemctl restart  snmpd.service

- • ◆You may skip this step if you are using Hinemos Agent since this setting will be automatically configured during the installation of Hinemos Agent.
- • ◆If you are unable to find the configuration file “/etc/snmp/snmpd.conf”, the SNMP agent might have not been installed in your environment. If so, install the SNMP agent by executing the following command.
[root]# yum install net-snmp net-snmp-utils
2. Start Hinemos Client and open the “Monitor Setting” perspective.
↓↓ Click to enlarge↓↓
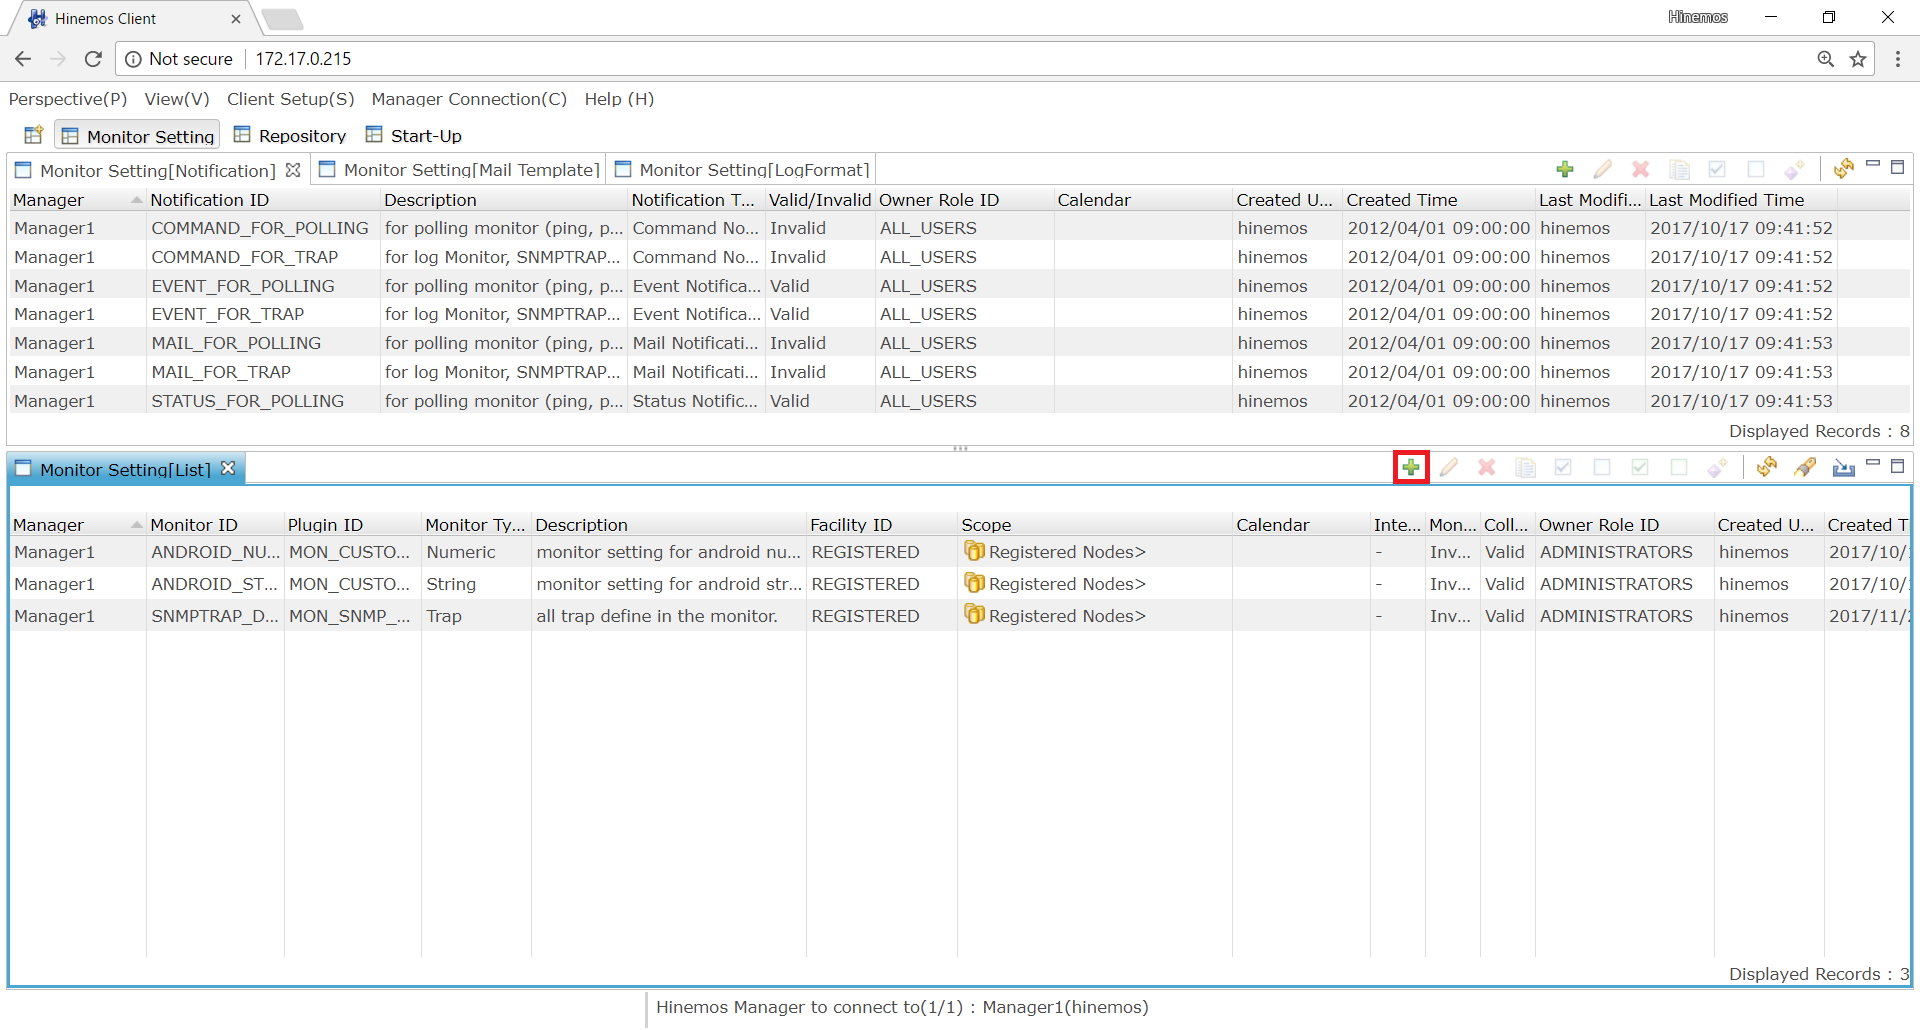
3. Press “Create” from the top right icon of the ”Monitor Setting[List]” view.
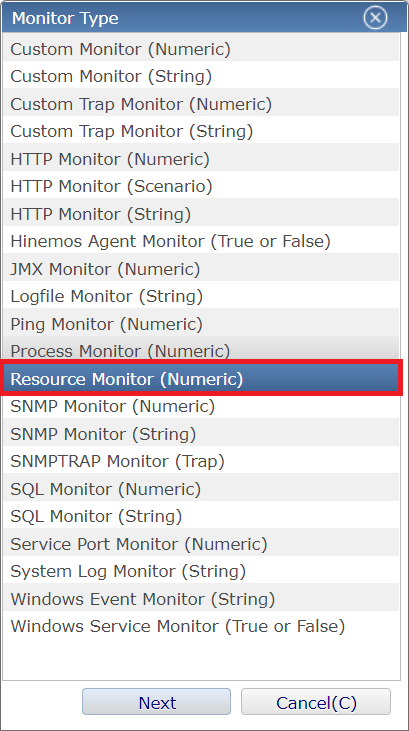
4. Select “Resource Monitor (Numeric)” from the ”Monitor Type” dialogue, and click “Next” to display the “Resource[Create/Modify]” dialogue.
↓↓Click to enlarge↓↓
5. The required fields in the “Resource[Create/Modify]” dialogue will be displayed in pink background. Fill in the fields as shown below. As for the notification method, select the default “STATUS_FOR_POLLING”.
↓↓Click to enlarge↓↓
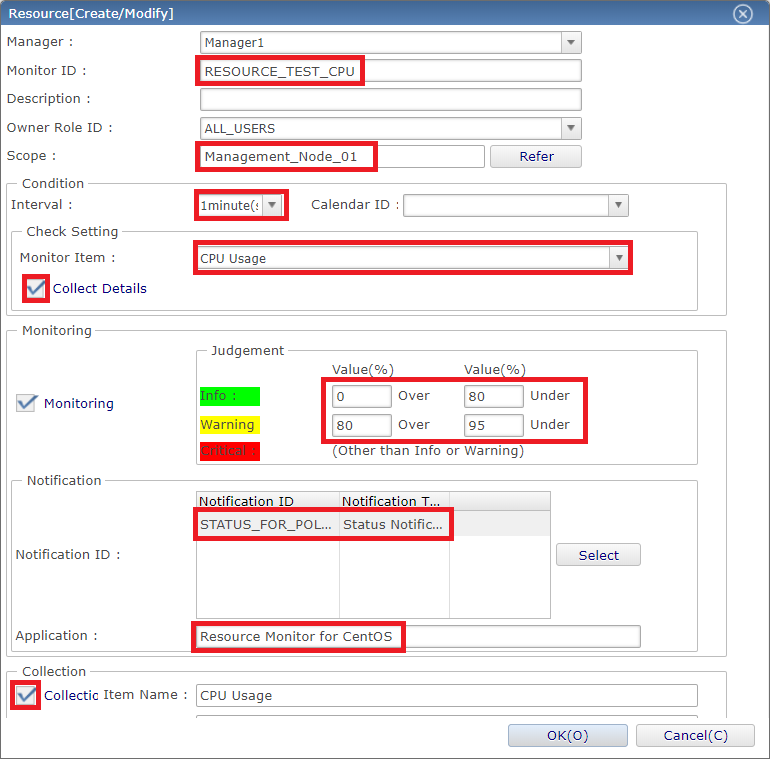
- ◆If you check the “Collection” check-box, the monitor results will be collected; you may display the collected data on graphs or export them as CSV files.
- ◆If you check the “Collect Details” check-box, for monitor items with specifications, those specification items will be collected also. For example, the specification items of CPU Usage will be the CPU usage of the User, System, Nice Process, and IO Wait.
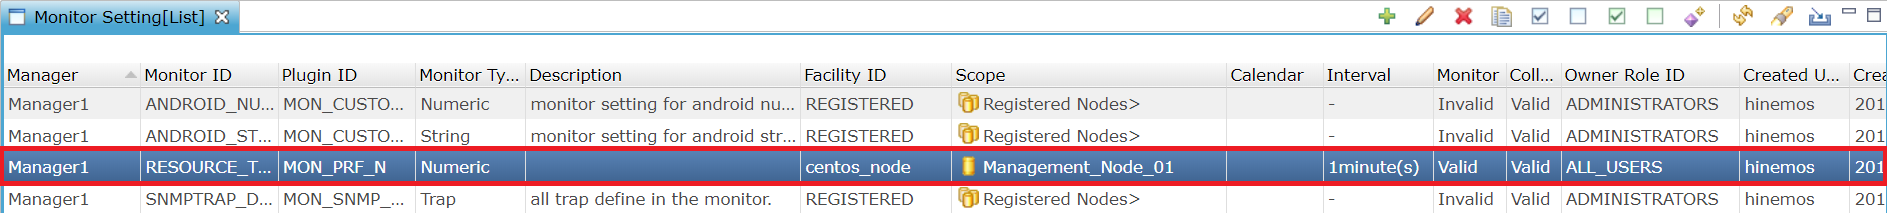
6. That is all for setting up the monitor setting for the CPU usage. From the ”Monitor Setting[List]” view, please confirm that the monitor setting is registered, and that the monitor and collection settings are enabled.
↓Click to enlarge↓
7. Next, let’s create a monitor setting for monitoring the file system usage and the amount of transferred network bytes.
↓Click to enlarge↓
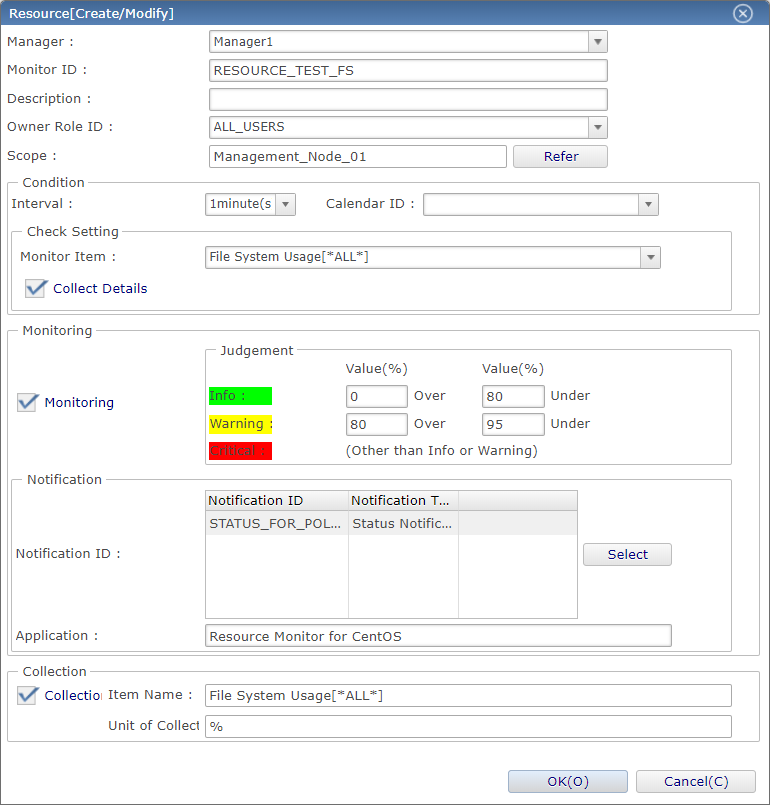
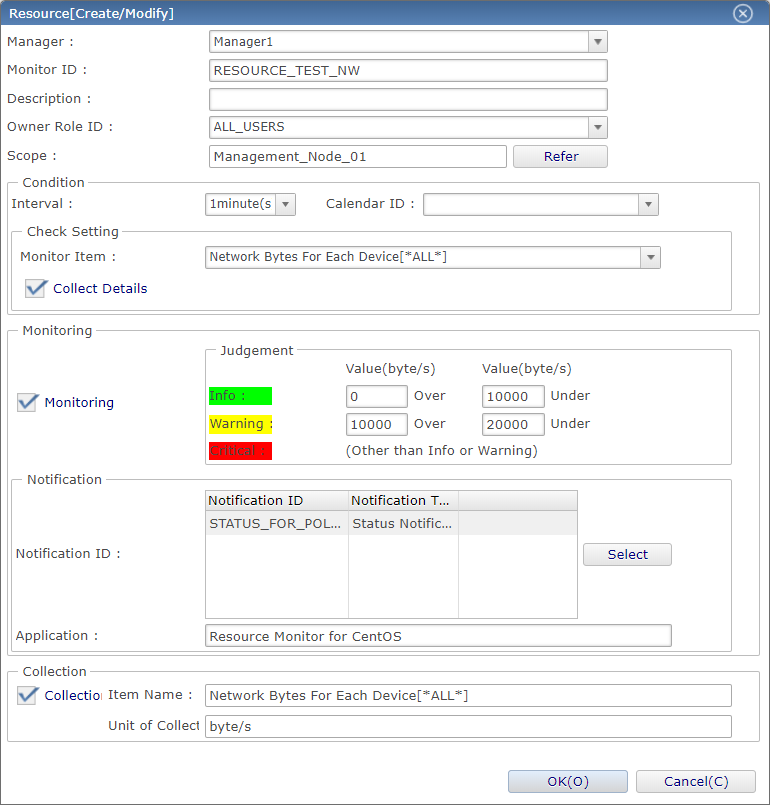
That is all for setting up the Resource Monitor setting.
- ◆In this tutorial, we have set the monitor interval to 1 minute so we would be able to receive monitor results quickly. However, in an environment with tons of monitor settings, we recommend setting the monitor interval to 5 minutes or more to avoid Hinemos Manager from experiencing high load. When creating a monitor setting on the actual production environment, please be sure to adjust the monitor interval according to your operation conditions.
Confirming the Monitor Result
Next, let’s check how the monitor results are displayed.
1. Open the “Monitor History” perspective from the menu bar.
↓Click to enlarge↓
2. If there are no particular processes running on the managed node, the CPU usage might not reach the threshold configured in the monitor setting and no notification will be triggered. So, let’s intentionally impose load on the managed node so it will be detected by Hinemos Manager.
- ◆How to impose High CPU load
Run the "yes command" shown below and it will push the CPU until its limit. After 2 to 3 minutes, stop the command using Ctrl-C.
[root] # yes >> /dev/null
- ◆How to increase the file system usage
Creating a large file will reduce the free space and raise the usage of the file system. The example command below will create 10GB dummy file. Please change the size of the dummy file according to your environment.
        [root] # cd /tmp
        [root] # dd if=/dev/zero of=bigtempfile bs=1M count=10000
- ◆How to increase the amount of transferred network bytes
Downloading or uploading a file will increase the amount of transferred network bytes. The example command below will transfer the dummy file created in the previous example to the manager server.
        [root] # cd /tmp
        [root] # scp /tmp/bigtempfile root@172.16.58.243:/tmp/
3. Next, press the “Update” button on the “Monitor History[Status]” view, and check whether the loads applied on the managed node has been detected. You can see in the image below that Hinemos Manager detected the load and output a notification indicating the CPU usage and the file system usage has exceeded the threshold.
↓Click to enlarge↓
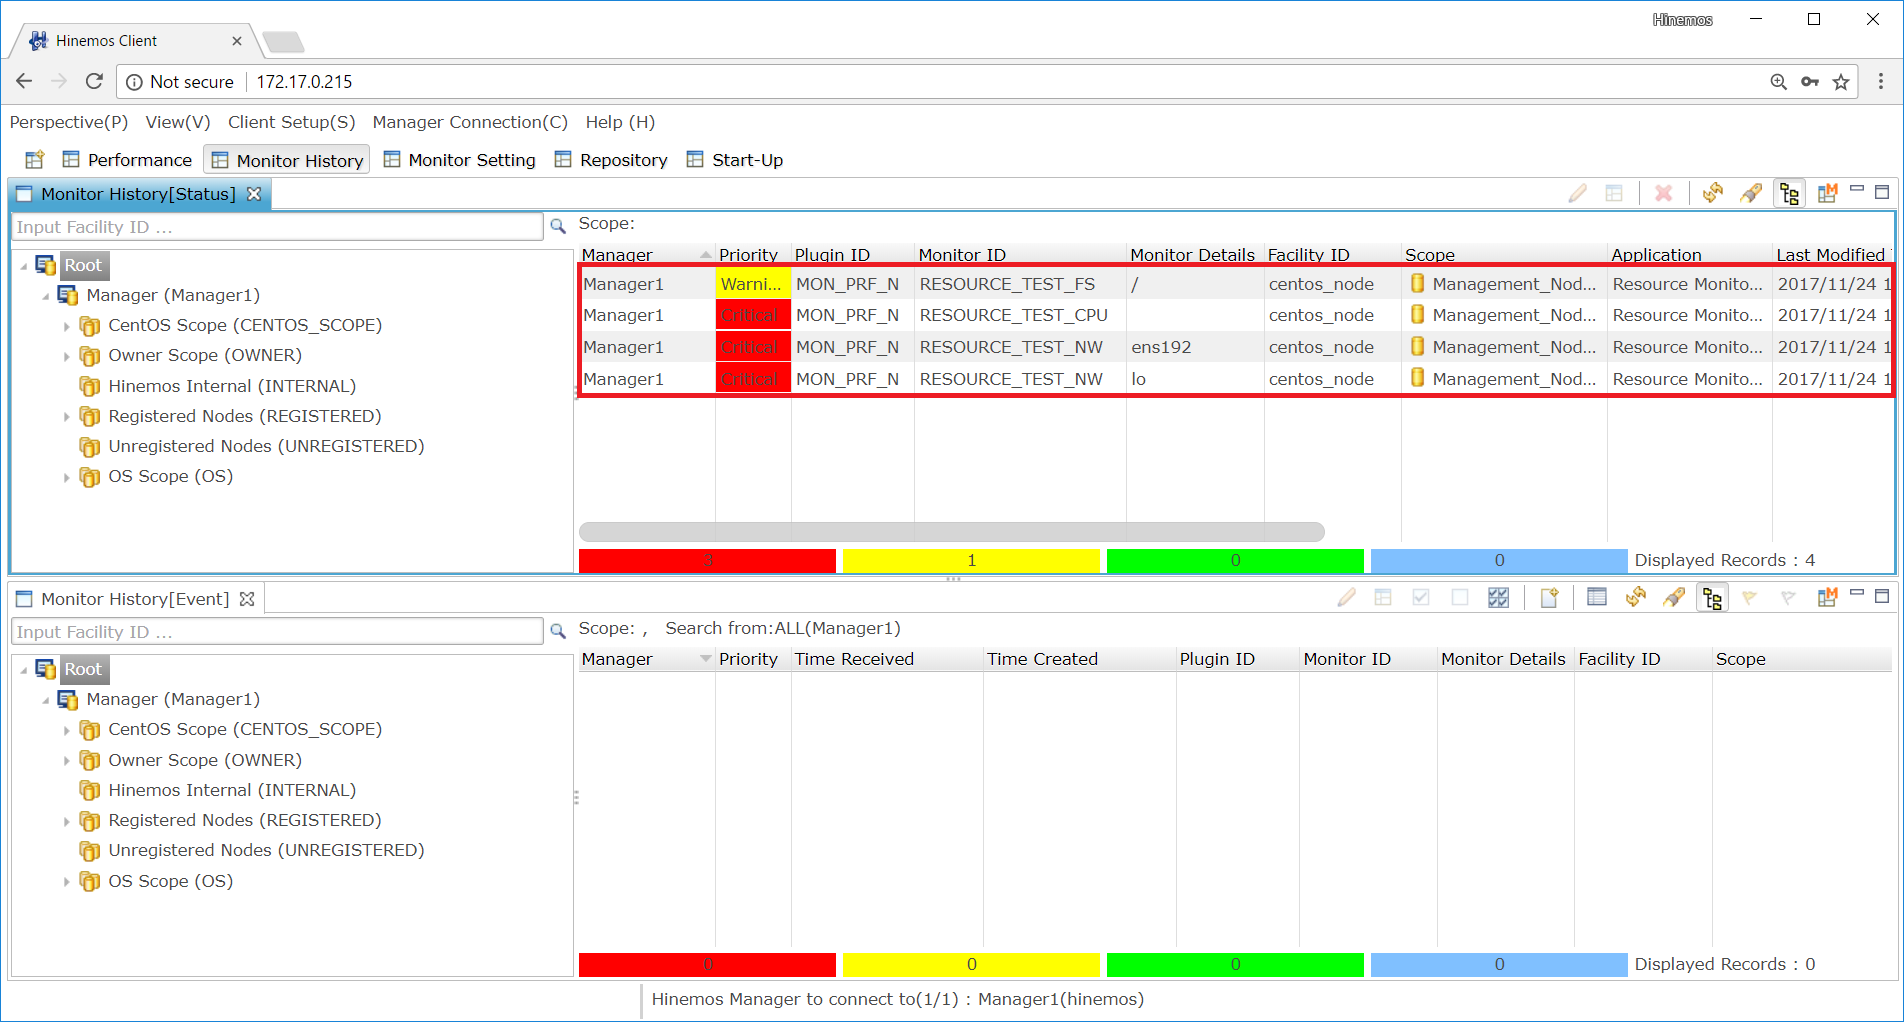
Scroll right on the “Monitor History[Status]” view and you will see the actual collected value in the message column.
↓Click to enlarge↓
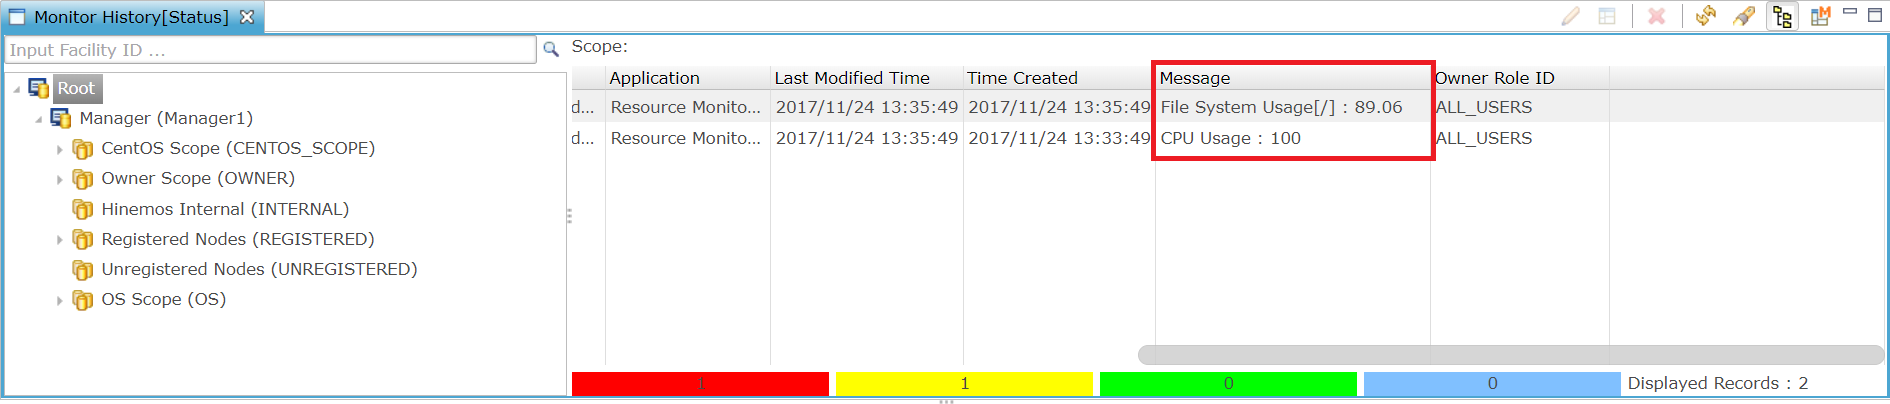
- The “Monitor History[Status]” view is updated every ten minutes by default. You may update the information immediately by pressing the “Update” button.
Confirming the Collected Data
By using the Performance feature, you can view the collected data on graphs and output the data to a CSV file.
The following steps will show you how to display the collected data on a graph.
1. First, open the "performance" perspective from the menu bar.
↓Click to enlarge↓
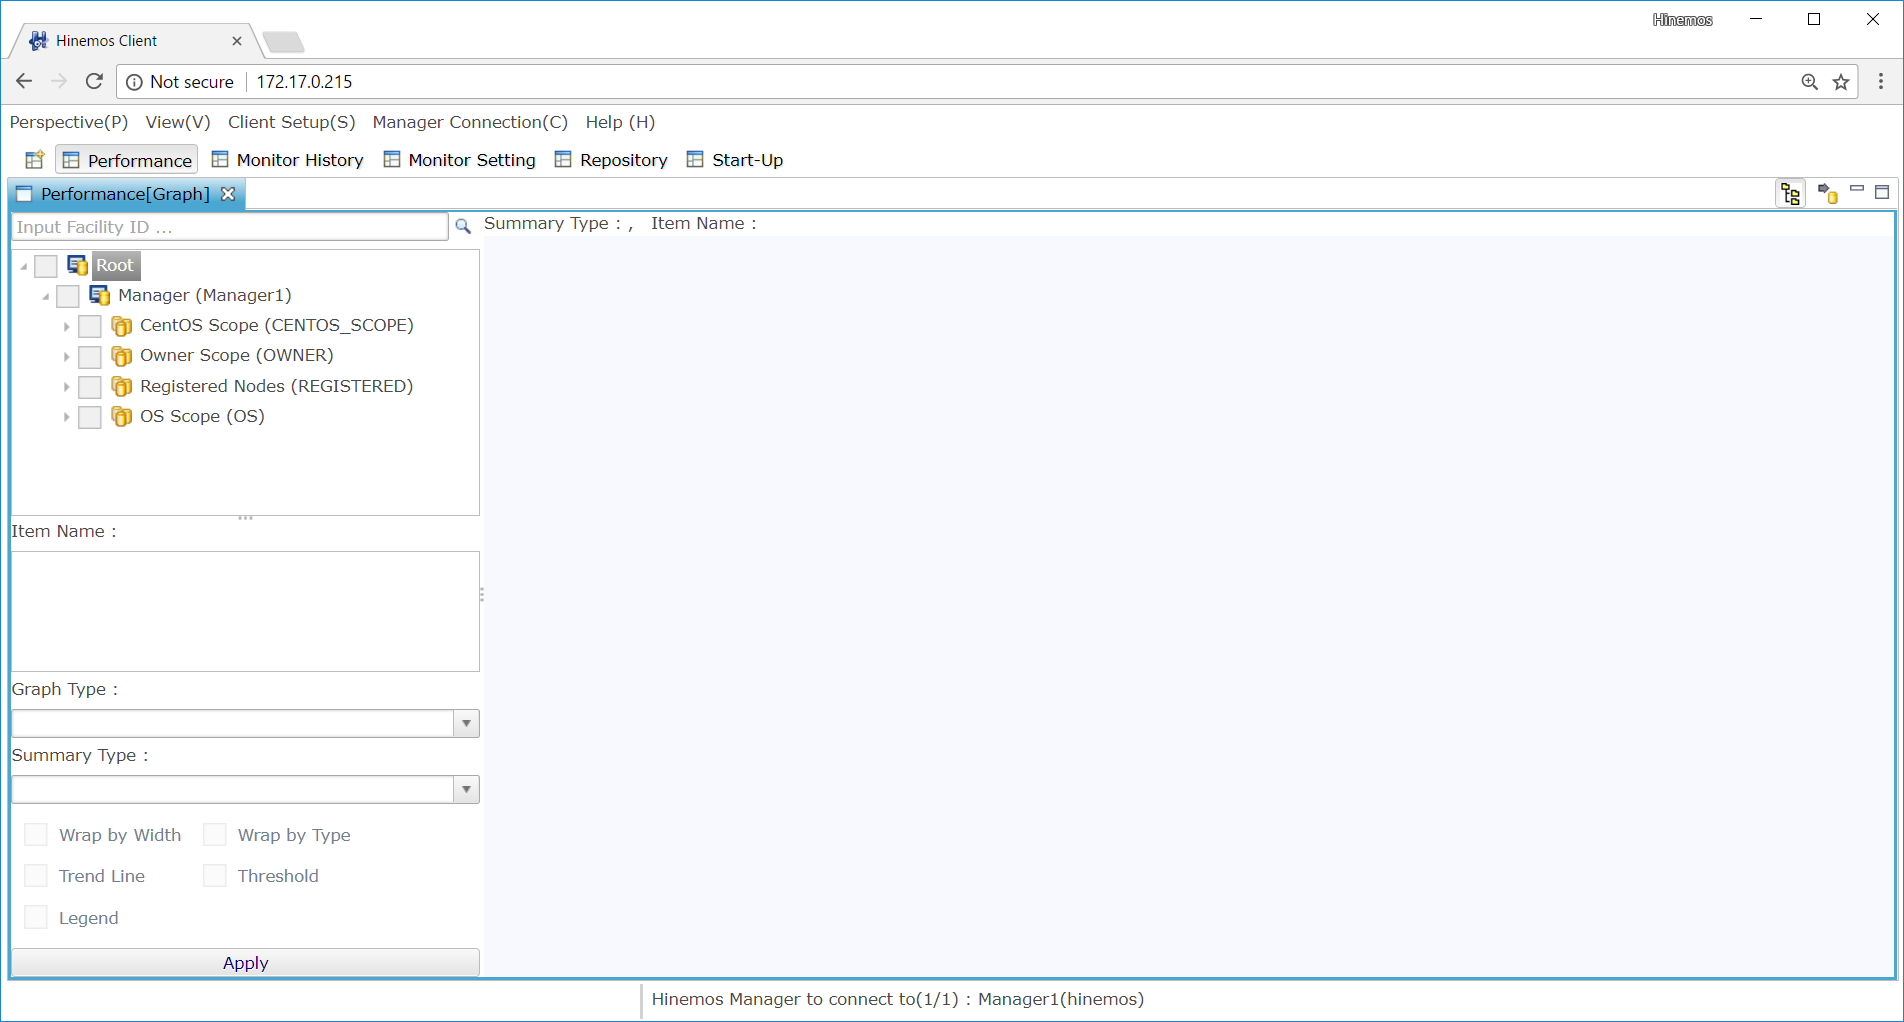
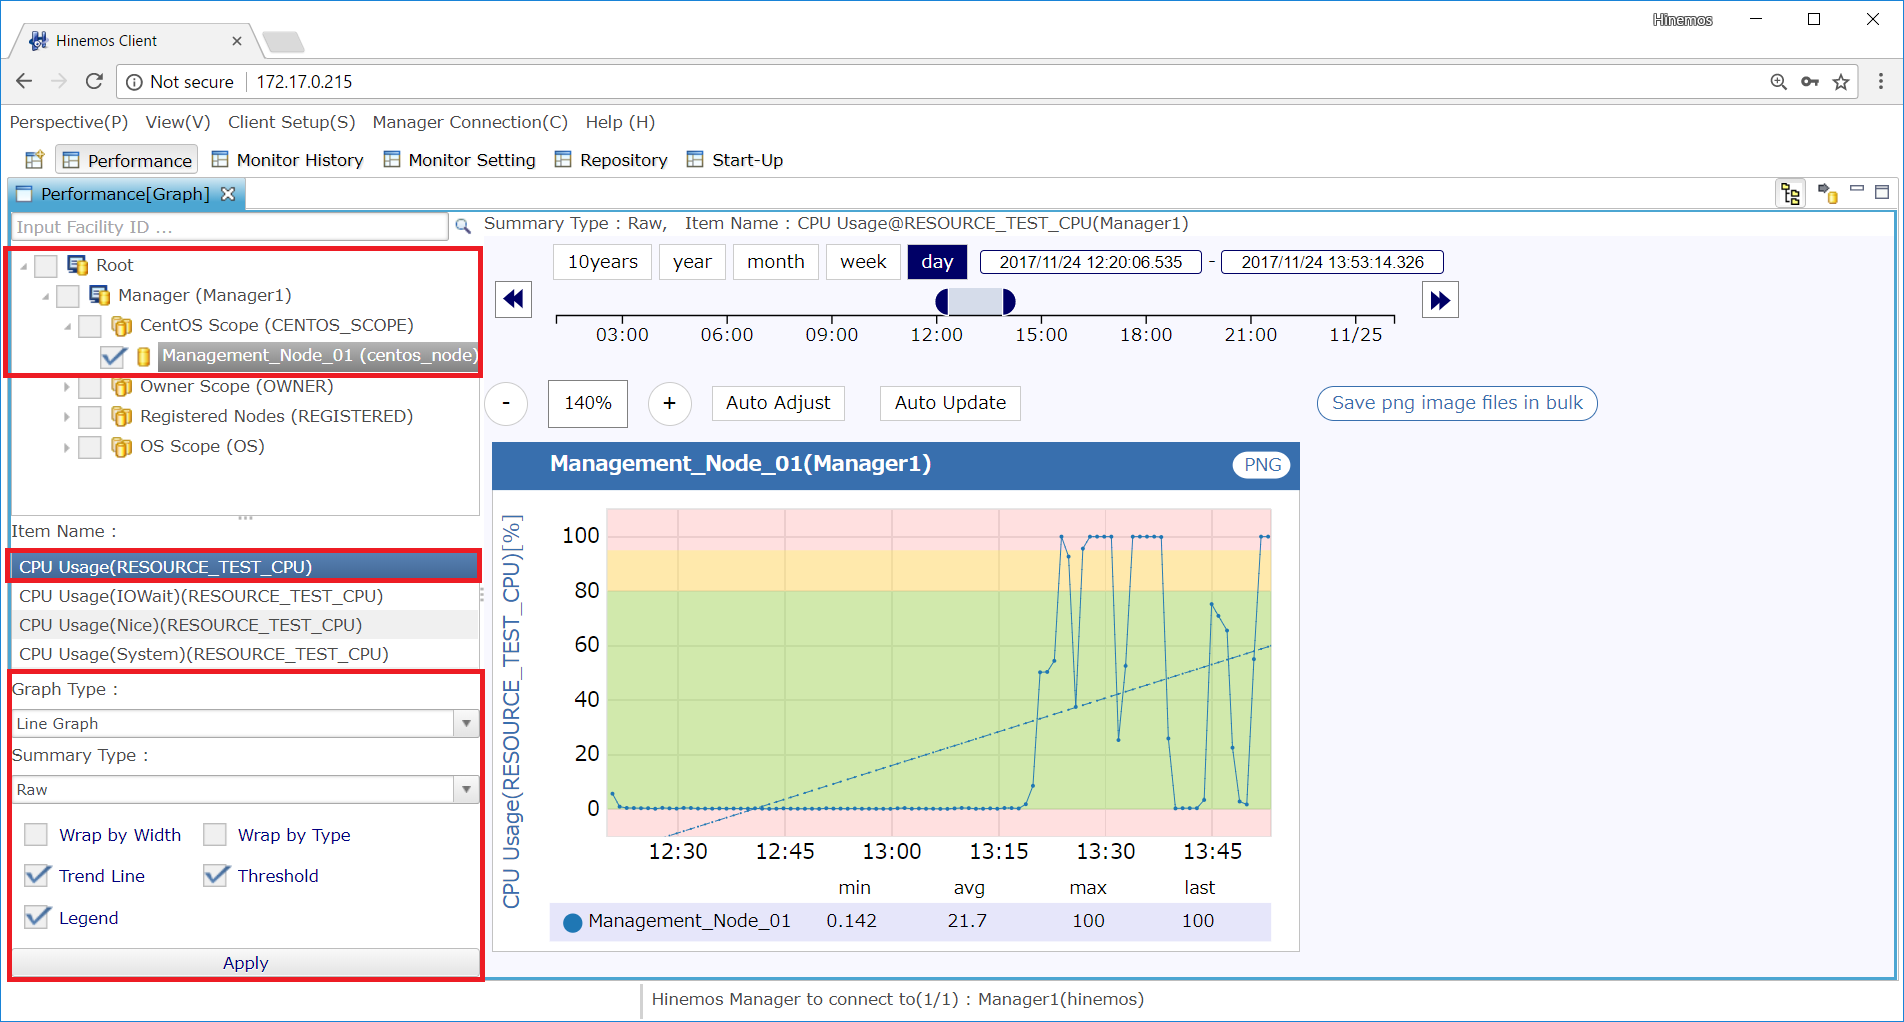
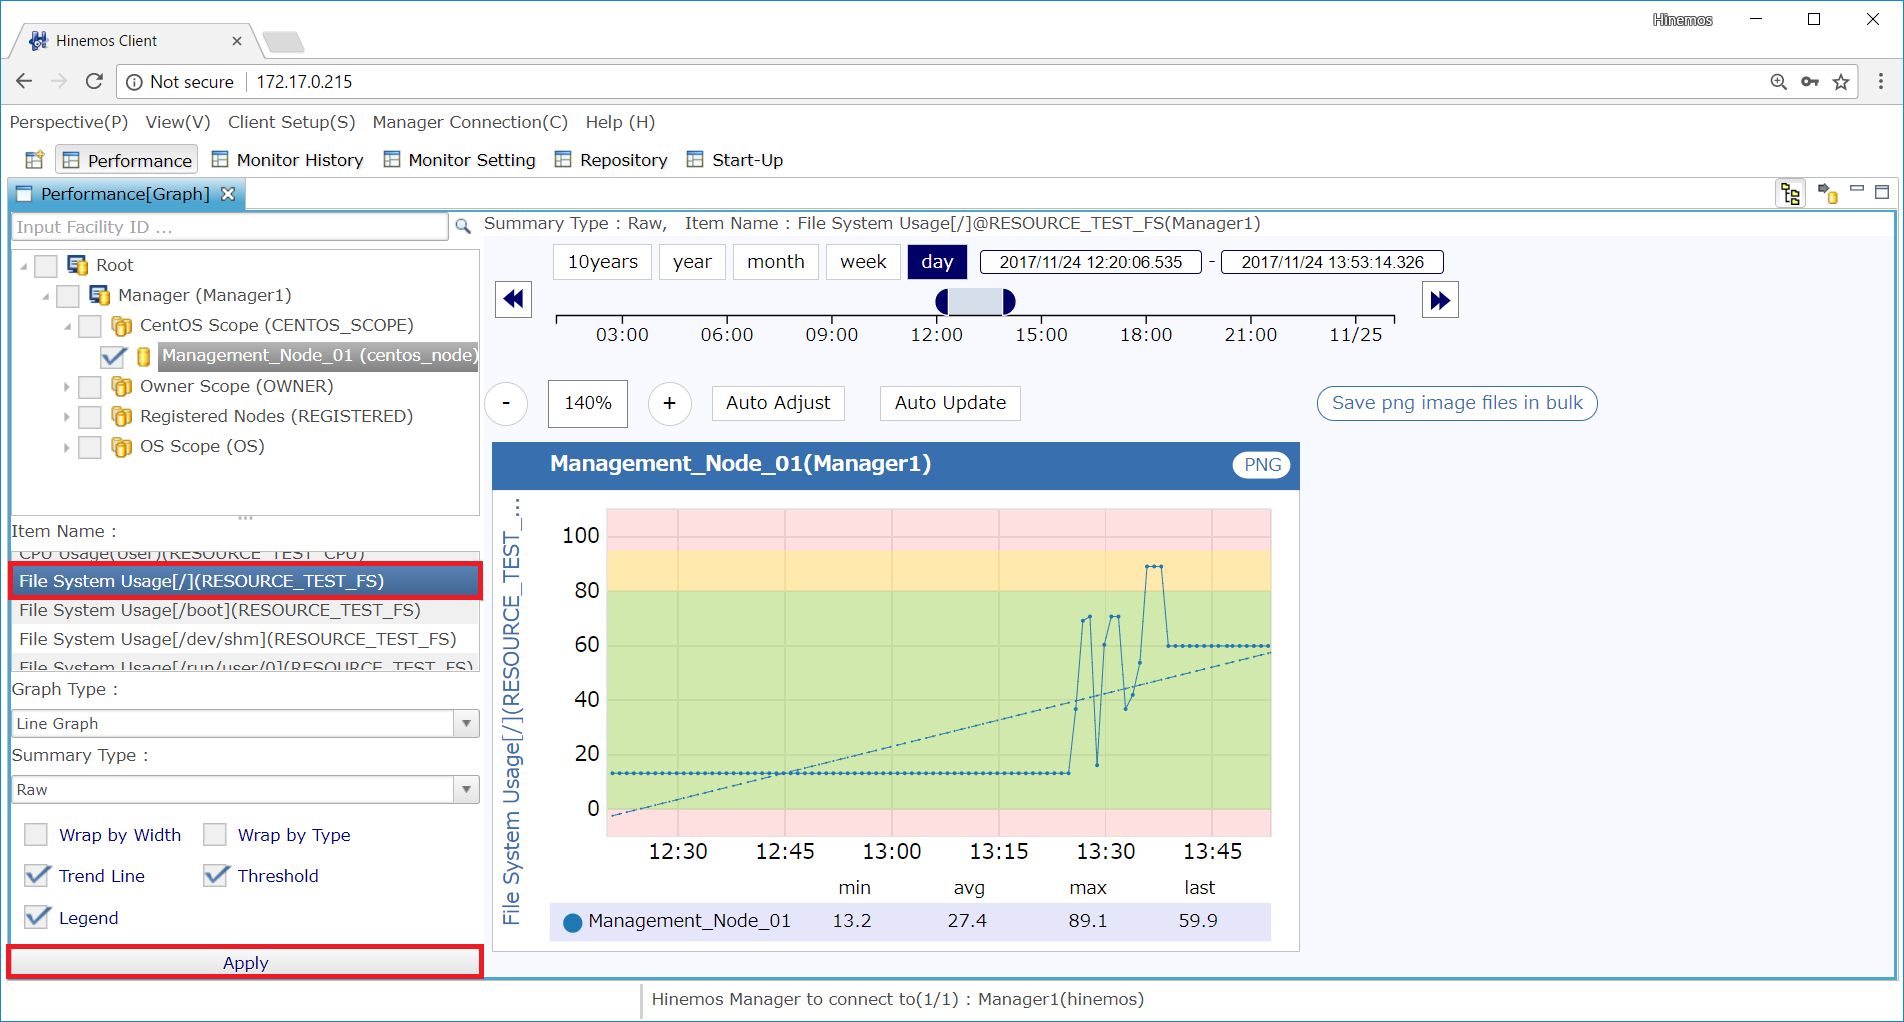
2. From the “Performance [Graph]” view, select “Root>Manager(Manager1)>CentOS Scope(CENTOS_SCOPE)>Management_Node_01(centos_node)”. Next, select “CPU Usage(RESOURCE_TEST_CPU)” from the Item Name list. After setting the graph type etc. as shown below, press the “Apply” button to display the data of the CPU usage on the graph.
↓Click to enlarge↓
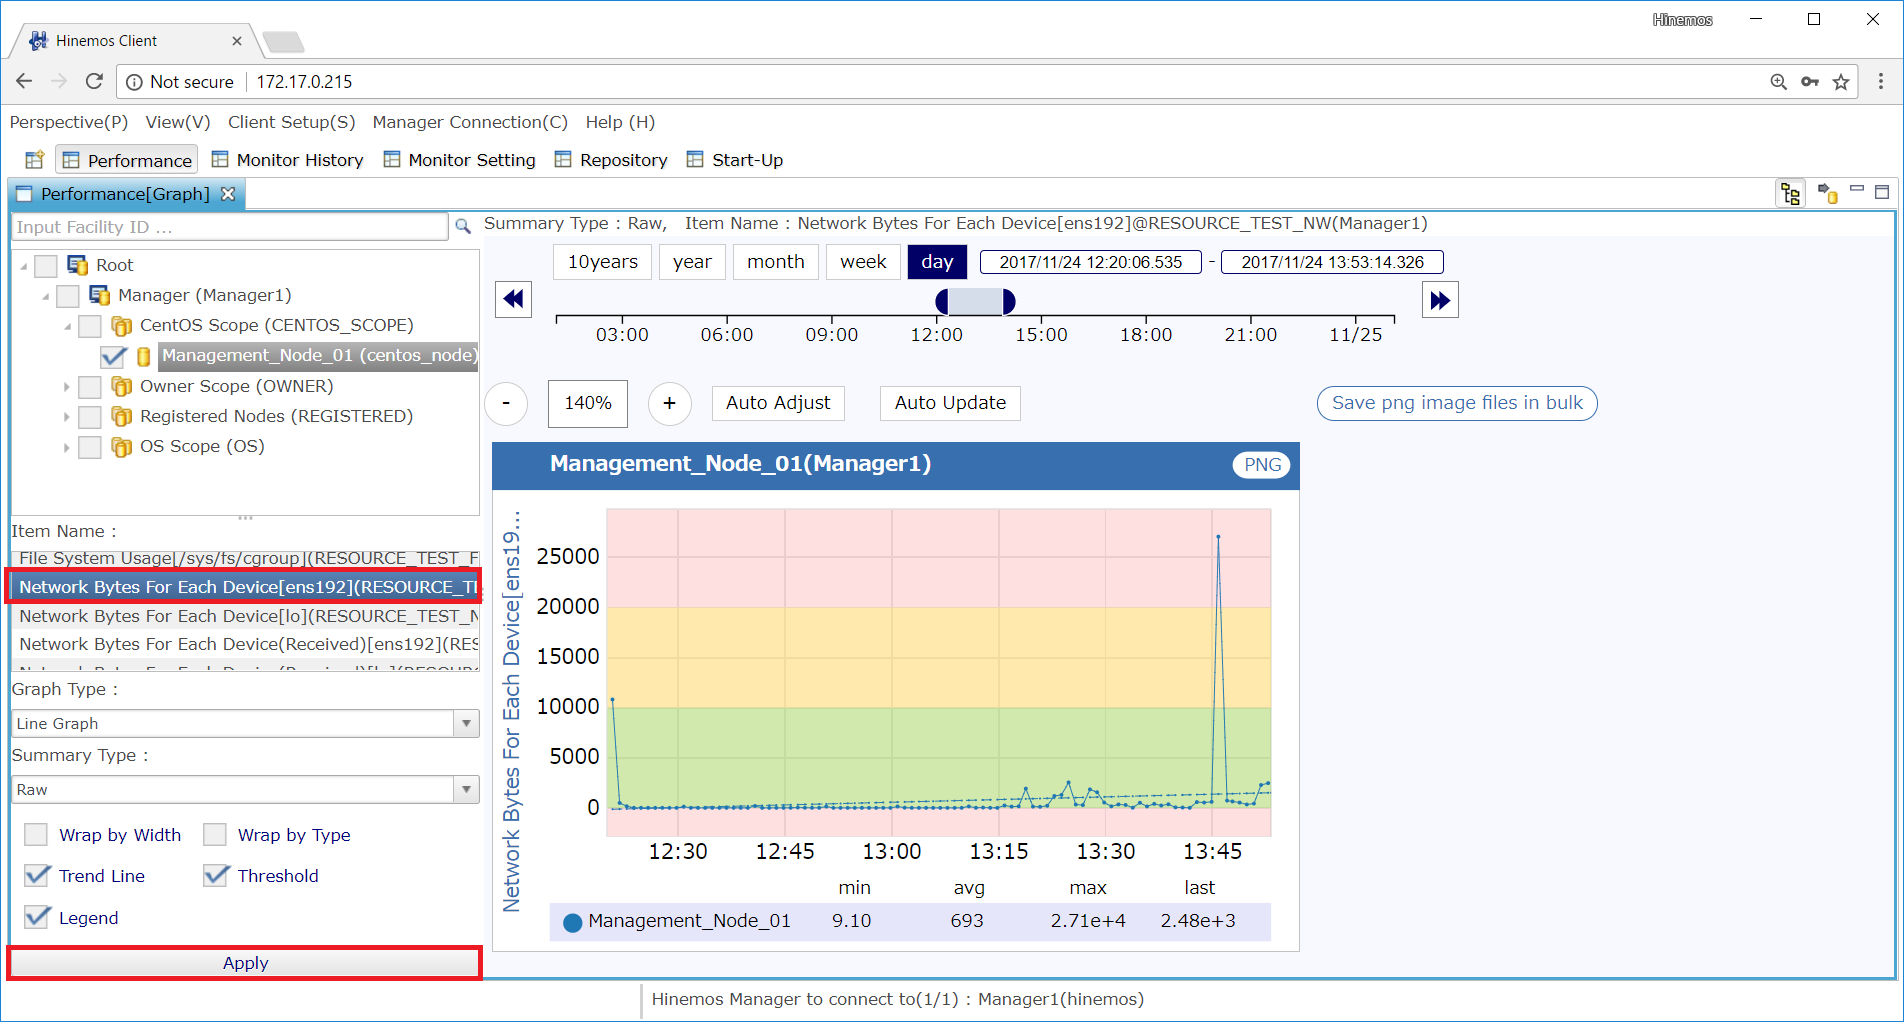
Display the graph of “RESOURCE_TEST_FS” and “RESOURCE_TEST_NW” in the same manner as described above.
↓Click to enlarge↓
- ◆By pressing the ”CSV Export” button on the top right corner of the “Performance [Graph]” view, you can download the collected values in CSV file format.
- ◆By pressing the “PNG” button on the top right corner of the graph, you can download the graph in PNG file format.
II. System Log Monitor
Next, we will introduce you the System Log Monitor.
The System Log Monitor feature, which belongs to the Character String Monitoring category, performs filtering of the monitored node's system log and notifies when the output log matches the specified matching condition.
Let’s configure a System Log Monitor and see how it works.
Procedures
1. Before starting anything on the Hinemos Client, because System Log Monitor uses “rsyslogd”, it is required to configure the managed node’s configuration file “/etc/rsyslog.conf” first. By using the command below, add“*.info;mail.none;authpriv.none;cron.none @@172.16.58.243:514” at the end of the file so logs will be transferred to Hinemos Manager. (172.16.58.243 is the IP address of Hinemos Manager)
        [root]# echo “*.info;mail.none;authpriv.none;cron.none @@172.26.58.243:514” >> /etc/rsyslog.conf
        [root]# cat /etc/rsyslog.conf
        ...
        # remote host is: name/ip:port, e.g. 192.168.0.1:514, port optional
        #*.* @@remote-host:514
        # ### end of the forwarding rule ###
        *.info;mail.none;authpriv.none;cron.none @@172.16.58.243:514
Restart rsyslogd to apply the change.
[root]# service rsyslog restart
- ◆You may skip this step if you are using Hinemos Agent since this setting will be automatically configured during the installation of Hinemos Agent.
2. Start Hinemos Client and open the “Monitor Setting” perspective.
↓Click to enlarge↓
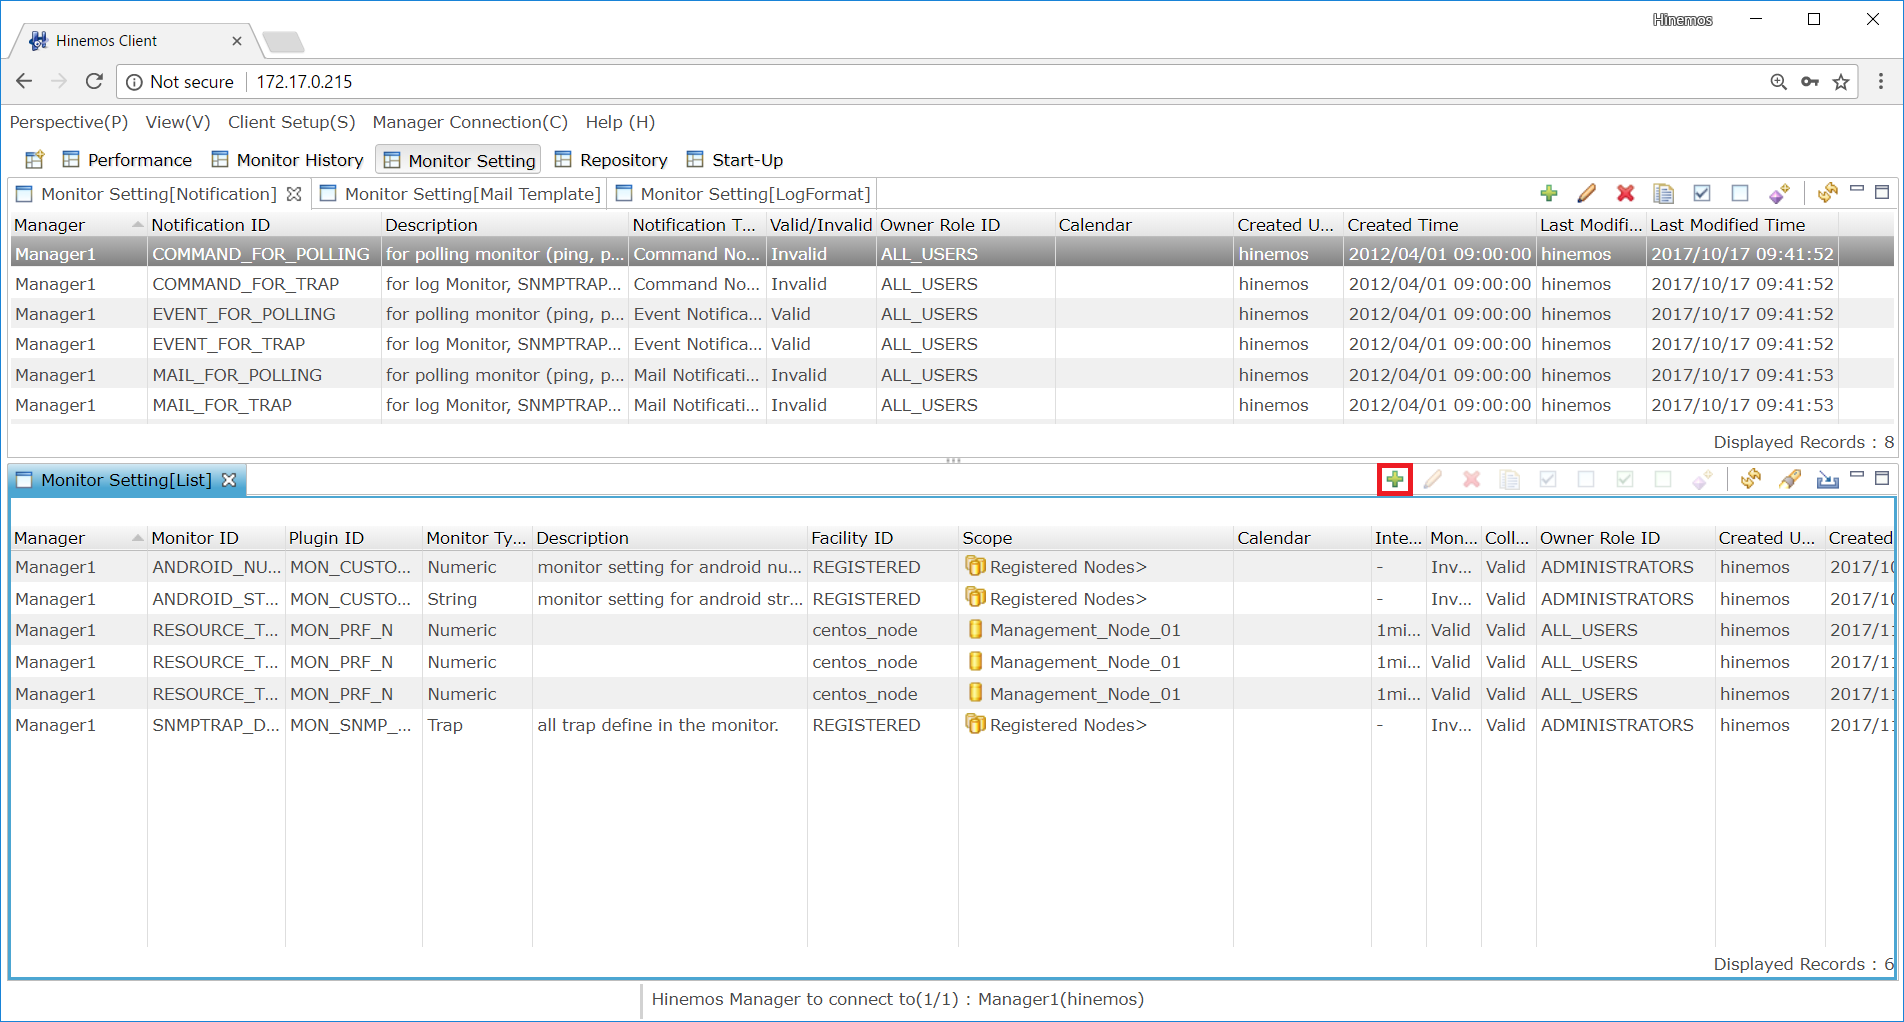
3. Press “Create” from the top right icon of the ”Monitor Setting[List]” view.
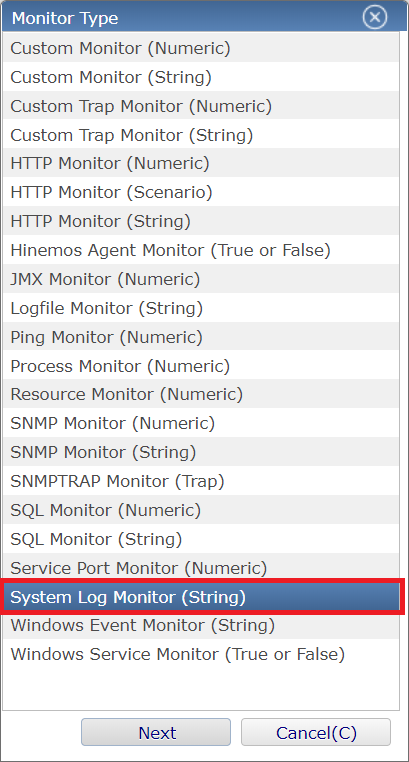
4. Select “System Log Monitor (String)” from the ”Monitor Type” dialogue, and click “Next”.
↓Click to enlarge↓
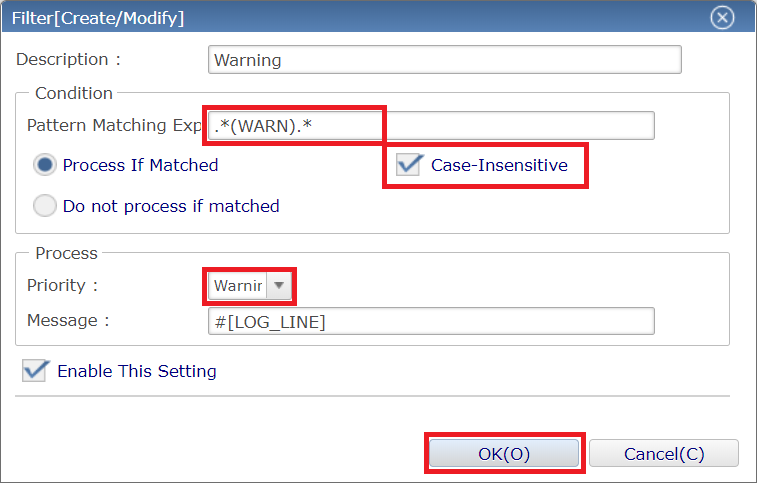
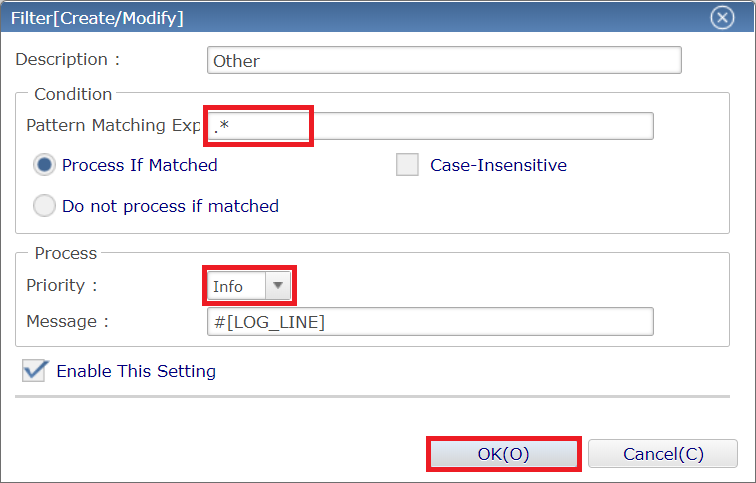
5. The required fields in the “System Log[Create/Modify]” dialogue will be displayed in pink background. Fill in the fields as shown below. As for the notification method, select the default “EVENT_FOR_POLLING”.
↓Click to enlarge↓
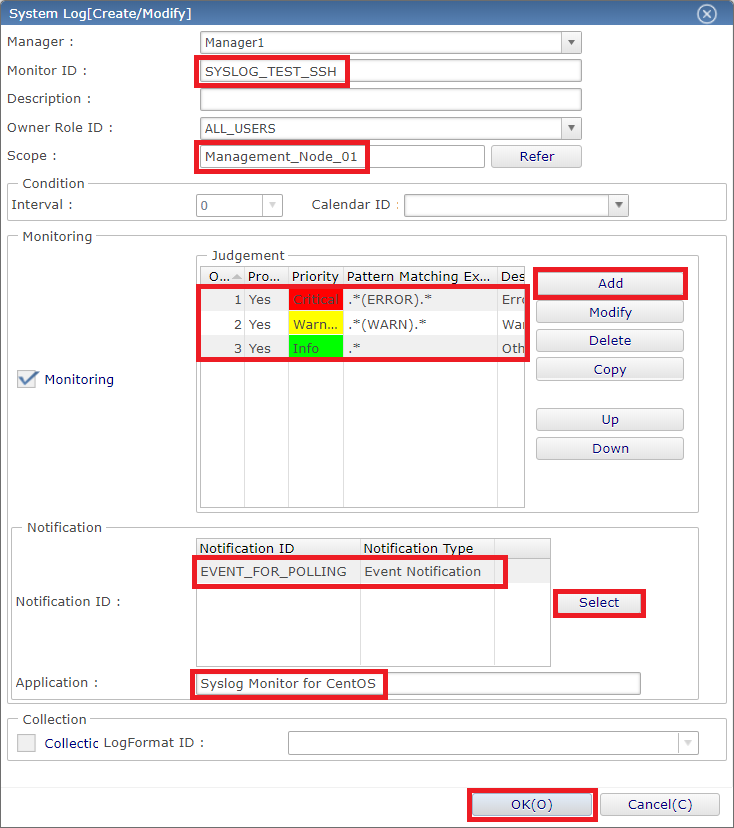
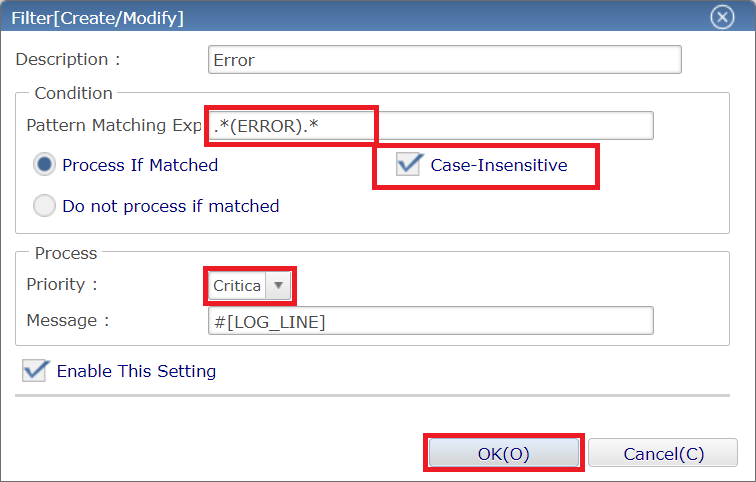
- ◆The status notification displays the latest notification result only. The event notification, on the other hand, will store and display the latest notification along with notifications output in the past. Therefore, we have chosen the status notification for the Resource Monitor, so users can always confirm the latest status, and the event notification for the System Log Monitor, so users can see the records of the log history.
- ◆The judgement will be carried out from the youngest number. Once a log message matches the pattern matching expression, the latter expressions will be omitted. If you wish to change the order, select the corresponding pattern match expression and press the “Up” and “Down” button.
That is all for setting up the System Log Monitor setting.
Confirming the Monitor Result
Next, let’s check how the monitor results are displayed.
1. Open the “Monitor History” perspective.
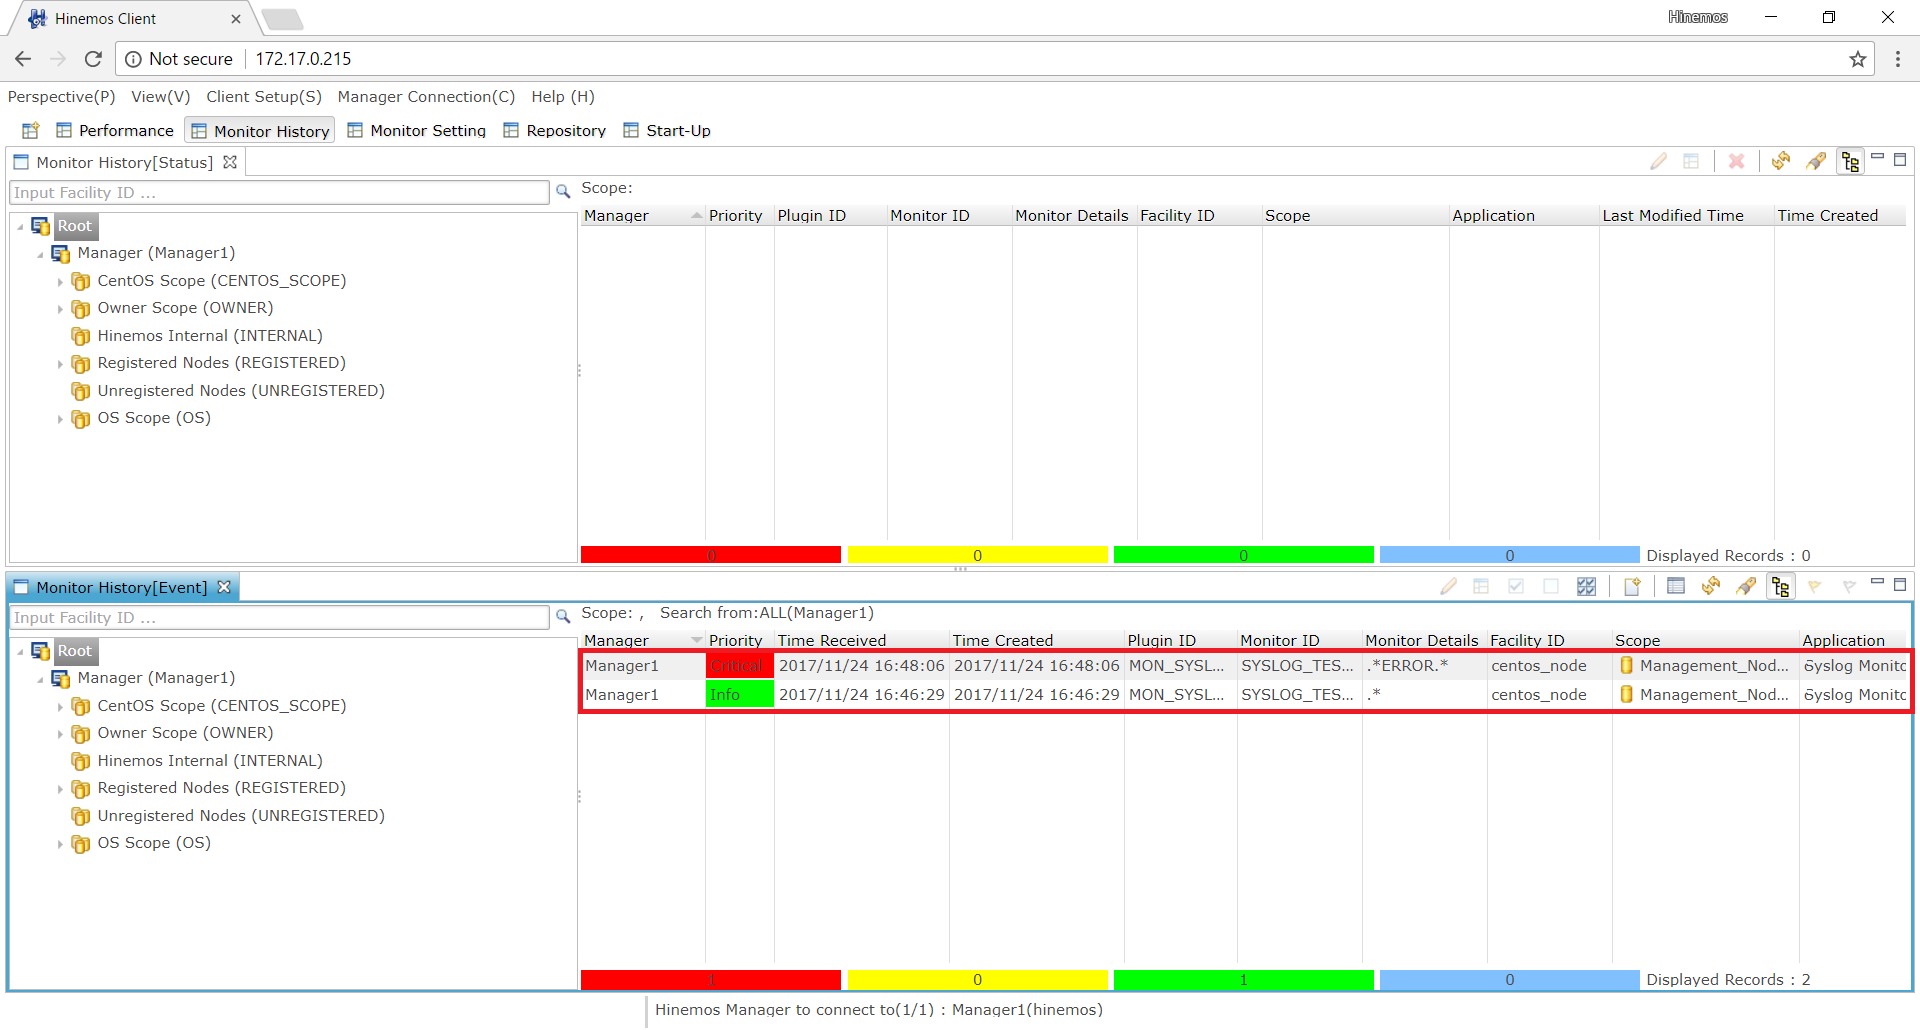
2. Output log messages to the rsyslog by executing the commands below.
        [root]# logger "OK"
        [root]# logger "ERROR: error: An error occurred"
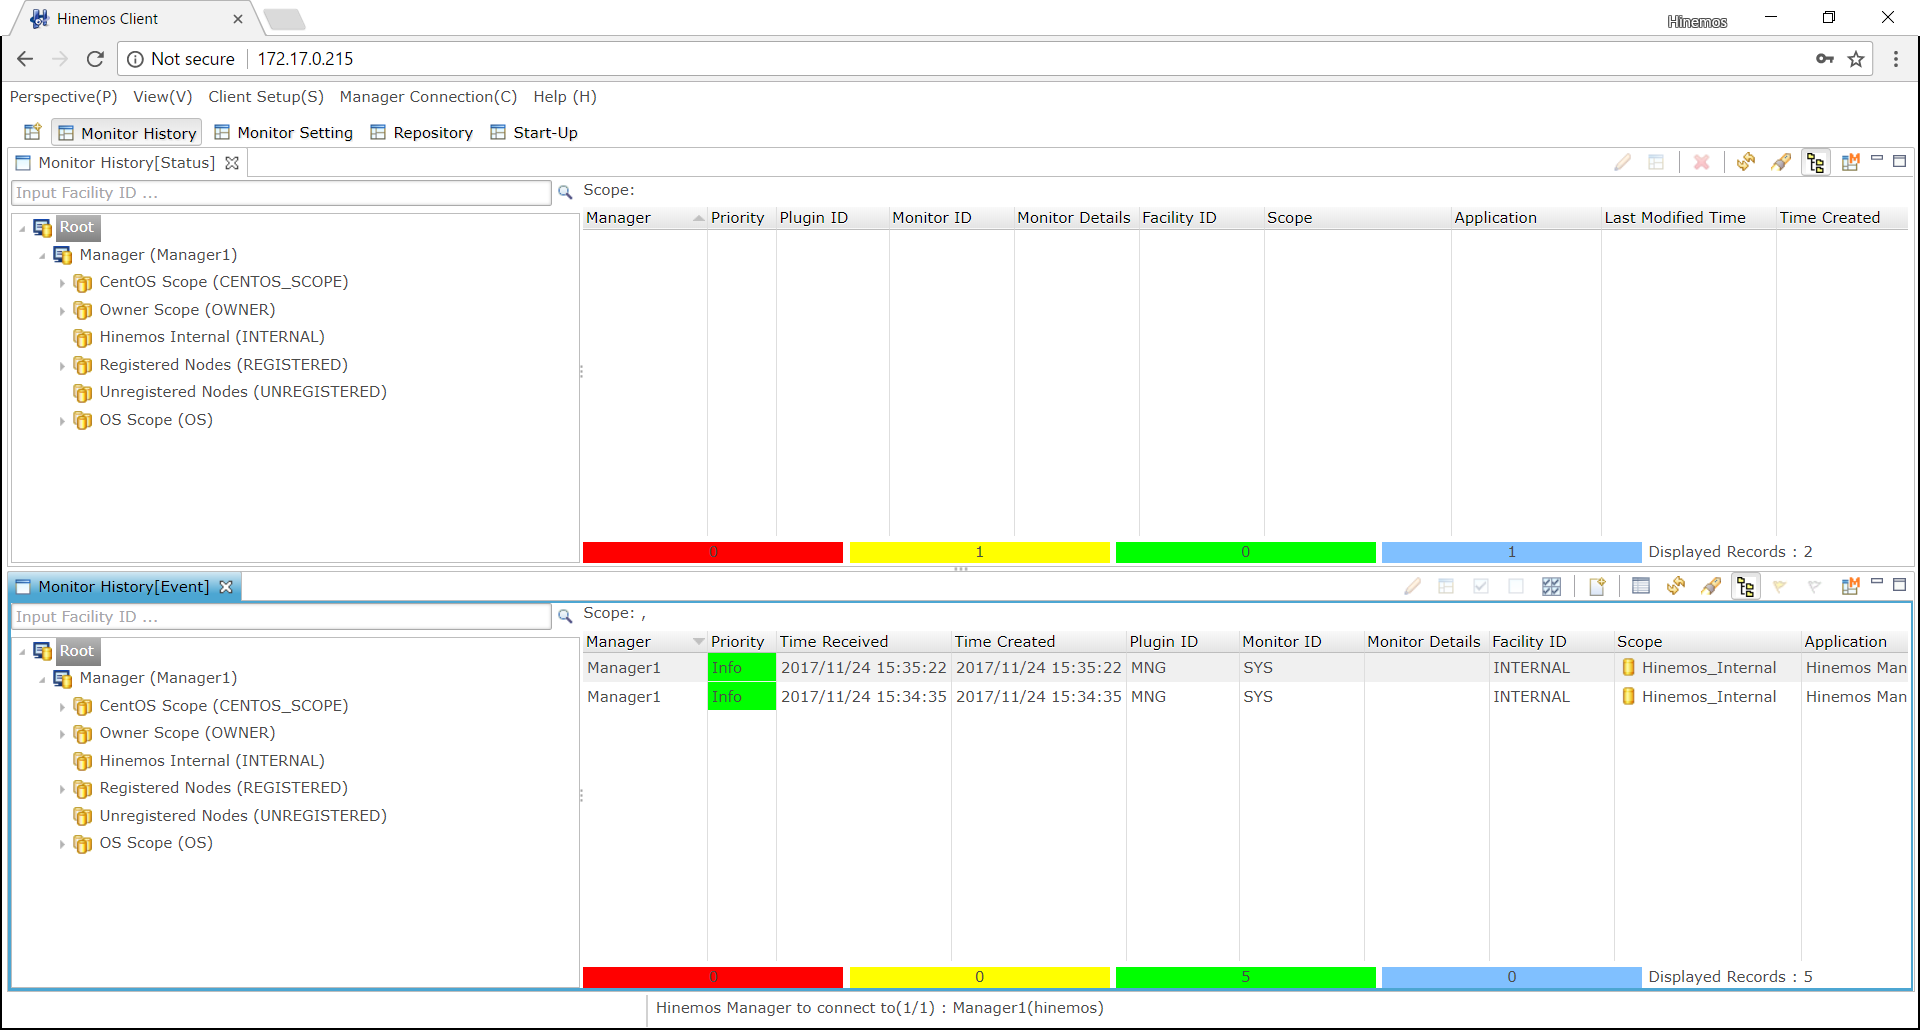
3. Click the “Update” button on the top right corner of the “Monitor History[Event]” view and confirm that two monitor results are notified: the “Info” with green priority, and the “Critical” with red priority.
↓Click to enlarge↓
Finally, confirm the details of the detected log messages. Double click or press the “Detail” button after select the corresponding event to open the Monitor[Event Details] dialogue.
Click the “・・・” button in the “Original Message” column of the Monitor[Event Details] dialogue to view to confirm the details of the detected log messages
↓Click to enlarge↓
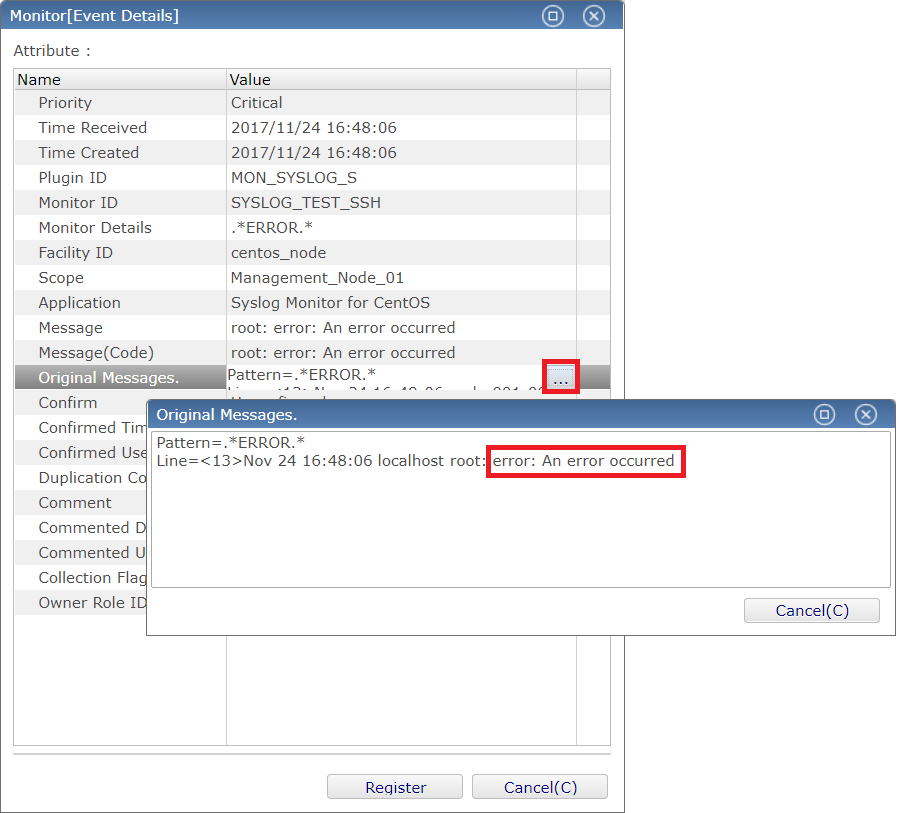
「オリジナルメッセージ」ダイアログが開き、検知したログの内容が確認できます。
- ◆In case of monitoring other logs, for example, the log file of Apache(/var/log/httpd/*), make sure to use the Logfile Monitor feature. Please note that installing Hinemos Agent will be required to use the Logfile Monitor. The details about the installation of Hinemos Agent will be explained in the next tutorial.
By default, the “EVENT_FOR_TRAP” setting is set to notify a notification of the same priority only once within 30 minutes. If you wish to notify all the notification, select ”Always Notify”.
Other Monitor Features
This tutorial explained how to setup and confirm the result of Resource Monitor and System Log Monitor. Hinemos is equipped with total of 16 different monitor features to suit the various purposes of the user. Of the 16 monitor features, 12 can be used without the installation of Hinemos Agent.
| Feature | Description | Agent-less |
|---|---|---|
|
・General IP network device Alive/Status Monitoring |
||
| PING Monitor (Numeric) |
Monitors the Alive status by judging whether there is a PING response from the monitoring target. |
○ |
| SNMPTRAP Monitor (Trap) |
Acquires the status of the target device by receiving the SNMPTRAP from the tar get device. |
○ |
|
・Product and Process Alive/Status Monitoring |
||
| Hinemos Agent Monitor (Truth) |
Monitors the Alive status of the Hinemos Agent. |
× |
| HTTP Monitor (Numeric/String/Scenario) |
Monitors the status from the HTTP response details, existence of a response and the response time for the Web server. |
○ |
| SQL Monitor (Numeric/String) |
Monitors the status from the SQL response details and existence of a response for the DB server. |
○ |
| Processe Monitor (Truth) |
Monitors the status from the number of processes that are running. |
○ |
| Windows Service Monitor (Truth) |
Monitors the status of Windows Service |
○ |
| Service Port Monitor (Numeric) |
Monitors the status from existence of a response and the response time for a specific service port. |
○ |
| JMX Monitor (Numeric) |
Monitors the status of Java application. |
○ |
|
・Monitor the resource status of various devices |
||
| Resource Monitor (Numeric) |
Acquires resource information for the monitoring target and monitors that status. |
○ |
|
・Monitor log messages |
||
| System Log Monitor (String) |
Monitors the messages output by the system logs of the various OSs. |
○ |
| Logfile Monitor (String) |
Monitors the messages output by a log file. |
× |
| Windows Event Monitor (String) |
Monitors the messages output by the Windows Event Log. |
× |
|
・General / Extensible monitor feature |
||
| SNMP Monitor (Numeric/String) |
Monitors details of the response from the general protocol SNMP. |
○ |
| Custom Monitor (Numeric/String) |
Monitors the execution results of a user defined command or script. |
× |
| Custom Trap Monitor (Numeric/String) |
Monitors the content of the request received in json format. |
○ |
- ★The monitoring features of Hinemos are classified in to the following 5 categories.
| Category | Description |
|---|---|
| Numeric |
Monitor settings which fit in to this category will monitor the numeric values of the target. Hinemos will evaluate the values based on the value you specify for the threshold and notify the results. For example, the Resource Monitor will belong in this category. |
| String |
Monitor settings which fit in to this category will monitor the character string of the target. Hinemos will perform a filtering to the character strings retrieved or sent from the target and send notifications according to the notification setting of the filter conditions. For example, the System Log Monitor will belong in this category. |
| Truth |
Truth monitoring judges whether the status of the monitoring target is "OK" or "NG" (no good) and send notifications according to the monitor results. For example, the Hinemos Agent Monitor will belong in this category. |
| Trap |
This category only applies to SNMPTRAP Monitoring. It will send a notification if there are any OIDs which match in the received SNMPTRAP. |
| Scenario |
By accessing several URLs in order, it will monitor whether the target will return a response properly when anticipated access to the target occur. It will send a notification if the status code and the HTTP response during the access to each URL match. Only the HTTP Monitor belong in this category. |
Summary
Introduction (2) introduced you the features and the setup of Resource Monitor and System Log Monitor. By following this tutorial, we hope you have understood how to setup a monitor setting and to confirm the monitor results. Please feel free to check out the other monitor features equipped in Hinemos according to your operation environment.
The next tutorial will introduce you to the job feature of Hinemos.
Other Startup Articles
Hinemos ver.6.0 Introduction(1) Getting Started with Hinemos
Hinemos ver.6.0 Introduction (3) Using the Job Feature of Hinemos ver.6.0
Contact Us
